반응형
1. 차트 생성 및 데이터 바인딩
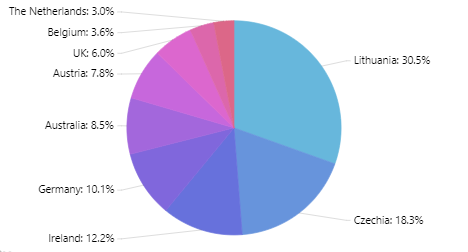
var chart = am4core.create("chartdiv", am4charts.PieChart);

//3D chart로 만들 경우
// am4core.useTheme(am4themes_animated);
//let pieChart = am4core.create("pieChartDiv", am4charts.PieChart3D);

// 데이터를 직접 명시할경우
chart.data = [{
  "country": "Lithuania",
  "litres": 501.9
}, {
  "country": "Czechia",
  "litres": 301.9
}, {
  "country": "Ireland",
  "litres": 201.1
}, {
  "country": "Germany",
  "litres": 165.8
}, {
  "country": "Australia",
  "litres": 139.9
}, {
  "country": "Austria",
  "litres": 128.3
}, {
  "country": "UK",
  "litres": 99
}, {
  "country": "Belgium",
  "litres": 60
}, {
  "country": "The Netherlands",
  "litres": 50
}];

//data object를 넣을경우
//pieChart.data = chartData;
2. 차트 범례 설정
//범례 생성
chart.legend = new am4charts.Legend();
//범례 높이사이즈
chart.legend.maxHeight = 50;
//범례 스크롤 여부
chart.legend.scrollable = true;
//범례 이름 설정
chart.legend.labels.template.text="국가 : {country}";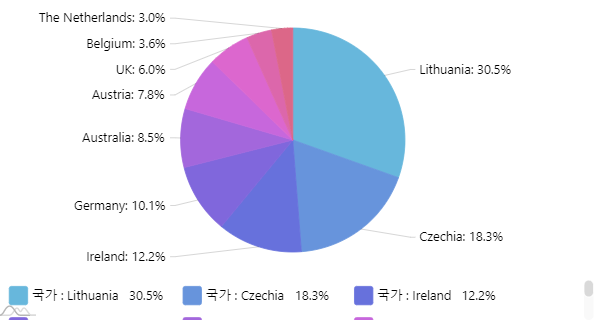
3. 차트 시리즈 설정
//차트 시리즈 생성
var pieSeries = chart.series.push(new am4charts.PieSeries());
//바인딩할 데이터 이름
pieSeries.dataFields.value = "litres";
//데이터 분류(category) 이름
pieSeries.dataFields.category = "country";
//파이 부분별 구분선 색
pieSeries.slices.template.stroke = am4core.color("#fff");
//파이에 마우스오버 시 표시할 툴팁 설정
pieSeries.slices.template.tooltipText="툴팁";
//파이 부분별 라벨 이름
pieSeries.labels.template.text = "{country}국가";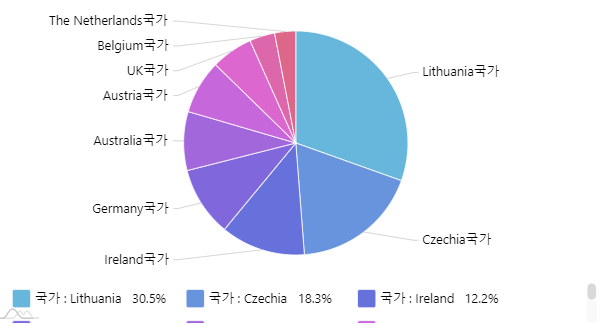
//저 수염처렁 주렁주렁 달린 라벨선을 삭제할 때
pieSeries.ticks.template.disabled = true;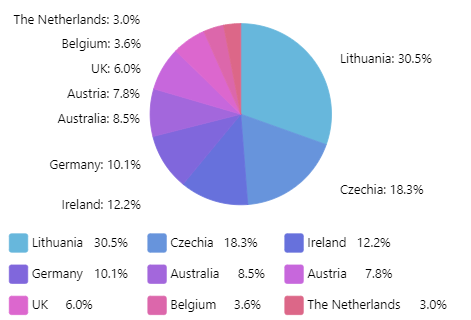
//라벨 자체를 싹 다 없애고 싶을 때
pieSeries.labels.template.disabled = true;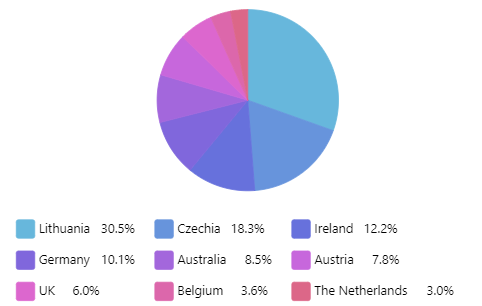
//가운데를 뚫고 싶다면
chart.innerRadius = am4core.percent(40);
반응형
'코딩 관련 > amchart' 카테고리의 다른 글
| [amchart] y축 그리드 커스텀 설정, 옵션 (valueAxis 설정) (1) | 2021.05.17 |
|---|